
Figures of Global Seal Level Study Result
Dec 7, 2017 | Views:210241 |
 Print Version
Figures of global seal level study result
(The three figures below had been presented in the Oceans ’14 Taipei conference.)
Dr. Yaoting Tseng
Marine Sciences Department, UTT
yaoting.tseng@utt.edu.tt
04 December 2017
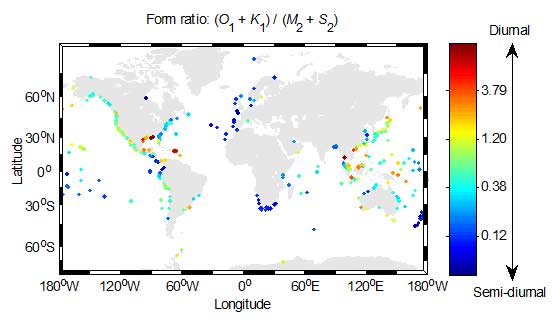
World map of global tidal pattern. It describes each individual tidal gauge station’s monitored sea level pattern either mainly dominated by diurnal (once a day) or semi-diurnal (twice a day) tide. One unique feature is the strong semi-diurnal tide along the east Atlantic Ocean.
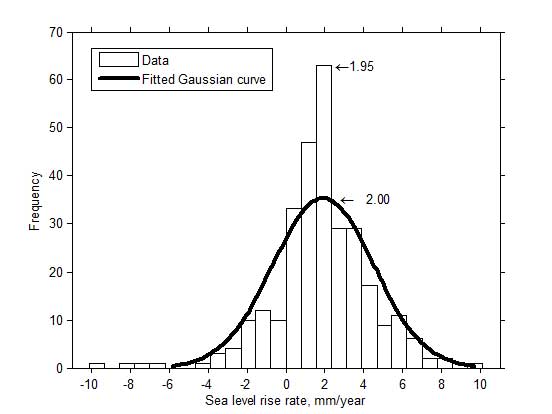
Global sea level overall rose at a rate of 2 mm per year in the past century, which is also consistent to the projections made by the Intergovernmental Panel on Climate Change. Although the most severe sea level rise rate of 13.24 mm/year happened at Manila, Philippines, the most severe sea level falling rate of 10.11 mm/year was also seen at Churchill, Canada. The observed sea levels on Earth are much more complicated than the theoretical models.
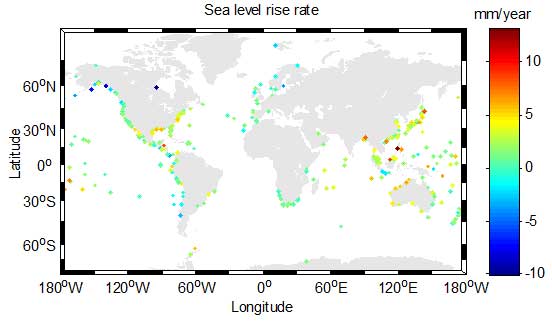
World map of global sea level rise rate. One unique feature is the comparably stable sea levels along the east Atlantic Ocean, which is also seen with strong semi-diurnal tidal pattern as indicated in the previous figure. While most sea level fallings are seen near the polar region, most sea level rises are seen in Asia.
More Results


